Raoul Miller – Enterprise Architect
When Oracle WebCenter Content made the architectural shift from a standalone J2SE application to a managed application running in WebLogic Server (WLS), the change provided a number of new capabilities for management, integration, and support. One of these capabilities is the version of Enterprise Manager that is built into WLS which allows administrators to monitor many different aspects of the WebCenter Content application.
If you haven’t been through formal WLS or Enterprise Manager training, the interface may seem complex or confusing. My speaking session at Collaborate 2016 in April explained how to use Enterprise Manager to monitor, optimize, and troubleshoot your WCC deployment(s) and I wanted to accompany that with a post here to provide a bit more context.
First a little background – there are multiple versions of Enterprise Manager (EM), and it’s important to be clear which one we are talking about. Those of us who have worked with the Oracle Database will be familiar with the original EM that’s been used to manage databases since version 9i. This is now specifically called Enterprise Manager Database Control.
At the other end of the spectrum there is the full-featured Enterprise Manager platform. This is a multi-tier set of applications which monitor and manage all aspects of your Oracle hardware and software deployment. We recommend it highly for large Enterprise clients, but it can be expensive and complex.
In the middle is the Enterprise Manager we will discuss today which is a set of web-based tools used to manage and monitor your WLS application server deployments. You access this at almost the same URL as the WLS administration interface – http://<WLS servername>:7001/em – note the /em rather than /console for WLS, and it’s possible you may not be using the standard 7001 port.
Your initial screen will show you what is deployed to your domain and whether the applications / servers are running or not.
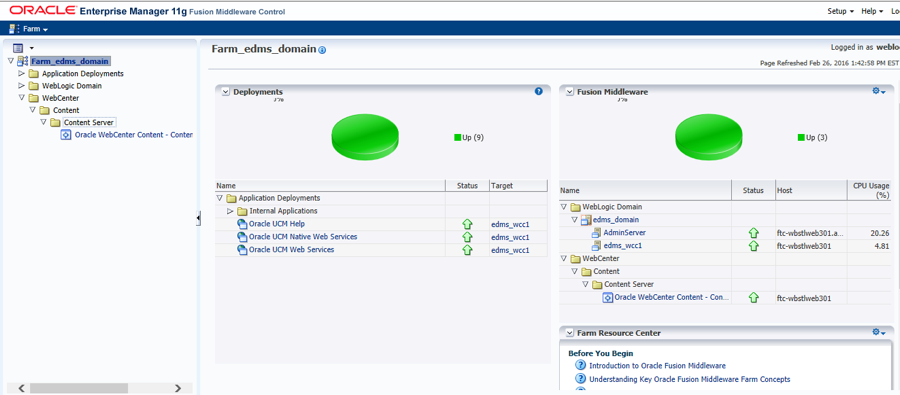
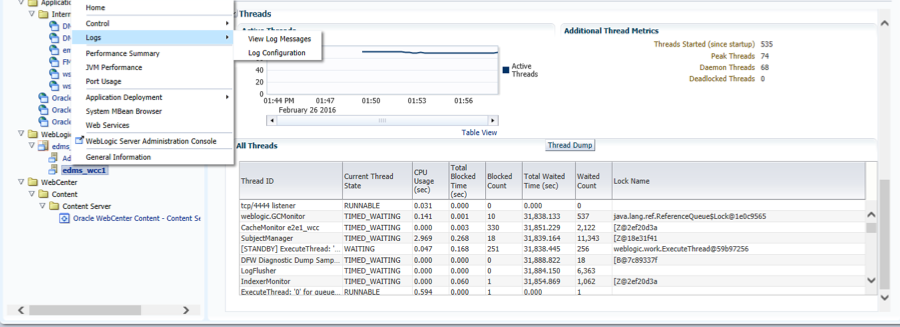
You’ll notice that there are lists of application deployments and managed servers within the domain and right clicking on any of these will show you custom actions for each.
Before we get to what to monitor and measure, let’s take a moment to review best practices when we are optimizing or troubleshooting WebCenter Content. As the java application architecture has stayed much the same over the years, the standard areas to focus on have remained fairly constant. It cannot be stated strongly enough that it is vital to look at ALL these areas, measure and test performance before making any changes, change one thing at a time, and then re-test and re-measure after making that isolated change. It’s very much an iterative approach as without data you are just playing around with inputs and outputs to a black box model.
The areas you need to monitor and measure when optimizing or troubleshooting WCC are:
- Java virtual machine
- File system
- Database (metadata and indexing)
- Network
- Authentication / authorization
- Customization / components
- Hardware
(I have to credit Brian “Bex” Huff and Kyle Hatlestad for their presentations back in the day at Stellent which taught me this approach.)
Enterprise Manager can help you with many of these areas, but not all – you need other tools to look at file system I/O and utilization, network speed and routing, and (non-oracle) hardware. However, for the other areas, EM can be extremely helpful. Let’s look at a couple of examples:
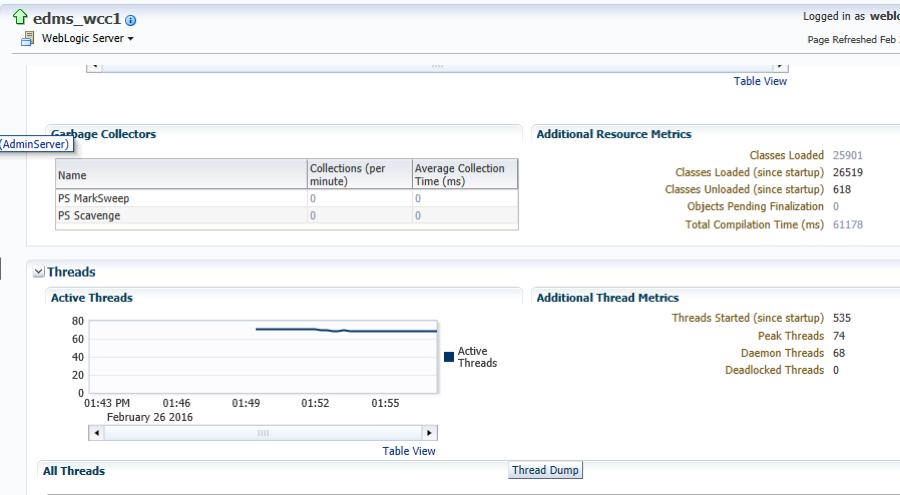
JVM metrics
Right click on the managed server instance and select JVM Performance
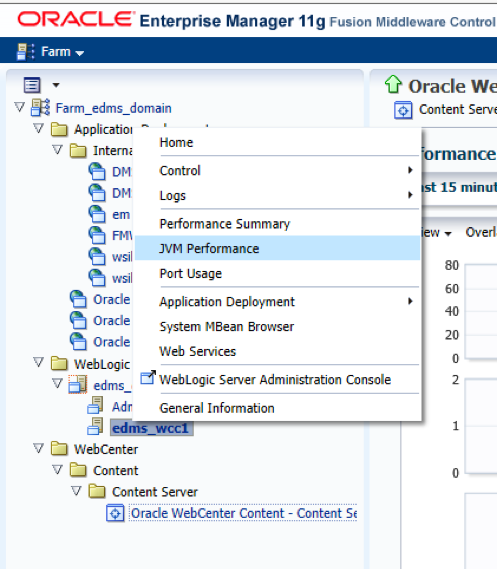
This brings up a pre-selected set of JVM metrics and a non-standard color scheme.
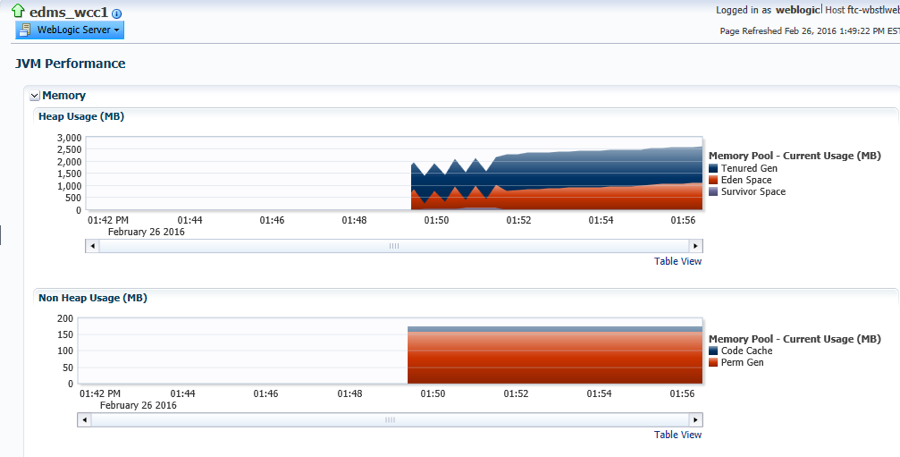
This will let you monitor the heap and non-heap memory usage in real time.
**TIP** You may see that the heap is smaller than you thought you had set it – I have often seen an issue where there has been confusion over where the non-default maximum and minimum heap sizes should be set.
Lower on the page you’ll see more granular data on JVM threads, objects, etc.
Datasource Metrics
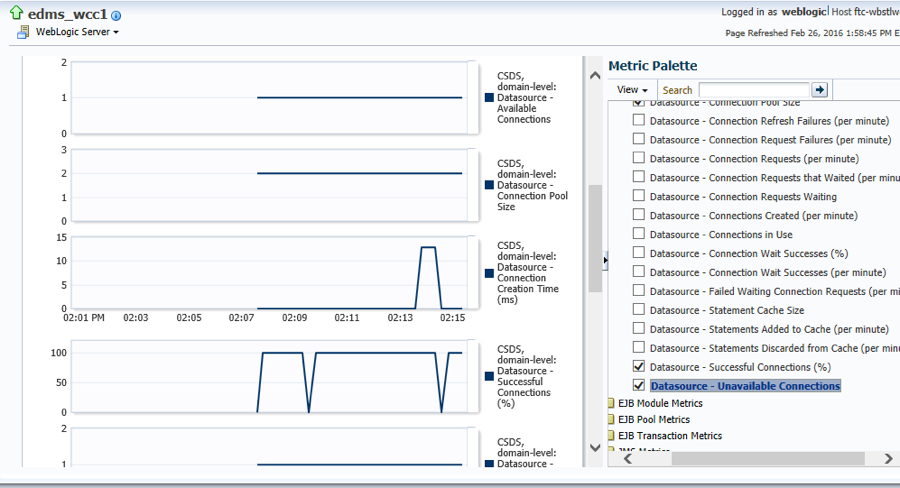
You’ll need to open the metric palette on the right side of the screen and open up the Datasource Metrics folder.
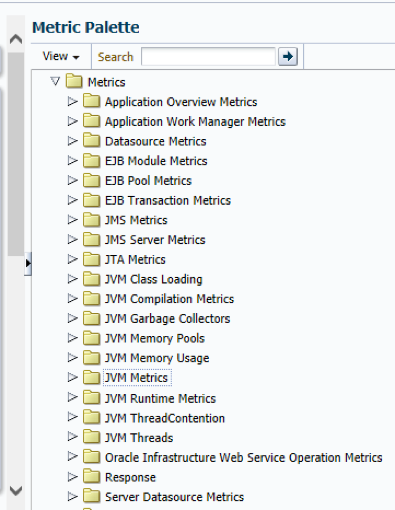
**TIP ** Make sure you choose this rather than the Server Datasource Metrics, because you will need to select the “CSDS domain-level Datasource”.
WebCenter Content Metrics
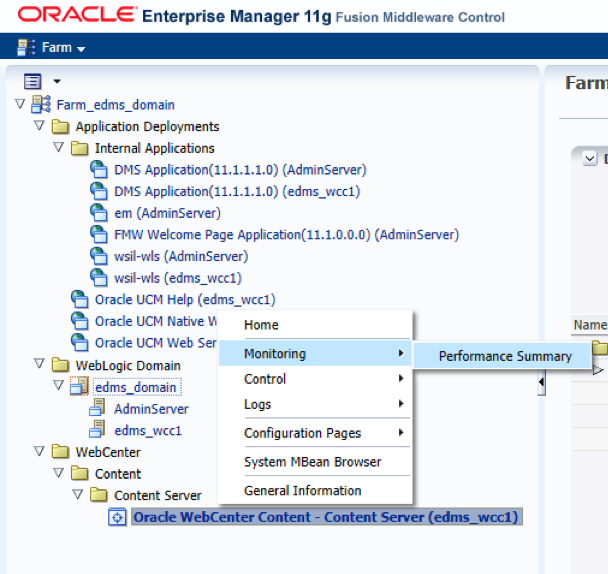
Navigate to the WebCenter Content Server deployment at the bottom of the folder list in the left hand area:
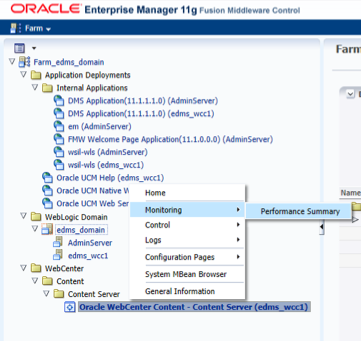
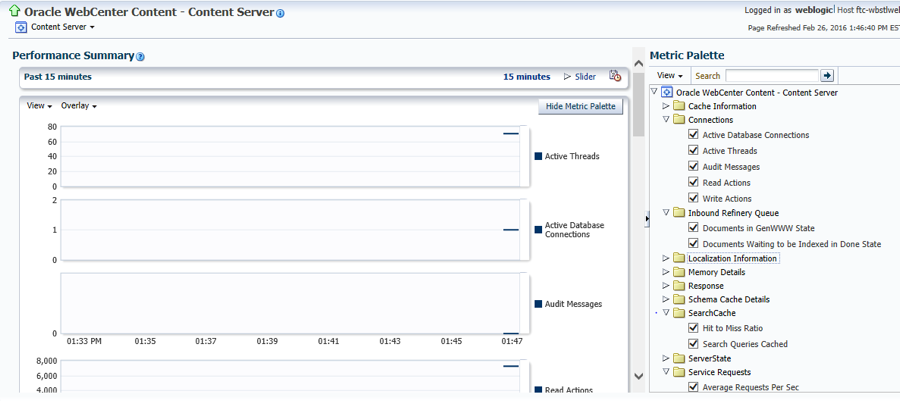
Select “Performance Summary” and you’ll see a pre-selected set of content-specific metrics in the graph area. As with all of the other selections, you can add or subtract metrics as you go – this short cut just gives you a good starting point.
We have only scratched the surface here of the capabilities of Enterprise Manager and its use for optimization of WebCenter Content. For much more information, download to my presentation from Collaborate 2016 or contact us through our website. We’ll be happy to discuss how we can further help you optimize and troubleshoot your WCC deployments.


No Comments Yet
Let us know what you think